
Interopvisual
What is it and what can you do with it?
Interopvisual is a visual toolkit that helps you map out the digital education landscape using consistent metaphors and imagery. Use it to help visualise processes, highlight bottlenecks in data exchange and collaboratively design solutions that contribute to a seamless learning pathway for learners.
Whether you work as an education professional, an information manager or a policy-maker, you can get started with Interopvisual yourself. At interopvisual.eu, you’ll find the resources you need to begin straight away, such as:
- a basic slide deck to help you tell your own story;
- an instructional video to help you get started;
- various animations that explain complex topics;
- real-world examples of the toolkit in action.
The value of Interopvisual
The visuals have been developed through numerous rounds of sketching with colleagues both at home and abroad. As a result, they align with how professionals in education work: starting with users, moving through processes, and on to information, applications and technology. And because everyone uses the same visuals, a sense of recognition and a shared understanding is created. This helps to clarify complex topics and reach shared insights together.
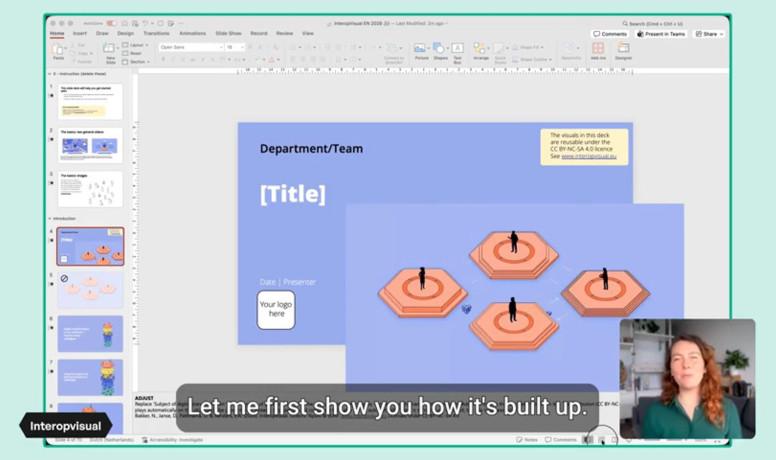
Getting started with the InteropVisual slide deck
Getting started
Go to the website: https://interopvisual.eu/nl. What story will you tell with Interopvisual?